Stock Analysis
- United States
- /
- General Merchandise and Department Stores
- /
- NasdaqGS:AMZN
A Look At The Fair Value Of Amazon.com, Inc. (NASDAQ:AMZN)
Key Insights
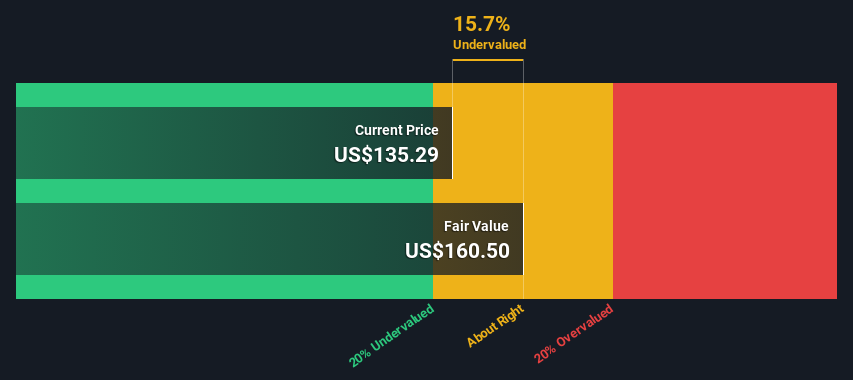
- Amazon.com's estimated fair value is US$160 based on 2 Stage Free Cash Flow to Equity
- Amazon.com's US$135 share price indicates it is trading at similar levels as its fair value estimate
- Analyst price target for AMZN is US$169, which is 5.3% above our fair value estimate
Today we'll do a simple run through of a valuation method used to estimate the attractiveness of Amazon.com, Inc. (NASDAQ:AMZN) as an investment opportunity by estimating the company's future cash flows and discounting them to their present value. This will be done using the Discounted Cash Flow (DCF) model. Believe it or not, it's not too difficult to follow, as you'll see from our example!
Companies can be valued in a lot of ways, so we would point out that a DCF is not perfect for every situation. Anyone interested in learning a bit more about intrinsic value should have a read of the Simply Wall St analysis model.
Check out our latest analysis for Amazon.com
The Calculation
We're using the 2-stage growth model, which simply means we take in account two stages of company's growth. In the initial period the company may have a higher growth rate and the second stage is usually assumed to have a stable growth rate. To begin with, we have to get estimates of the next ten years of cash flows. Where possible we use analyst estimates, but when these aren't available we extrapolate the previous free cash flow (FCF) from the last estimate or reported value. We assume companies with shrinking free cash flow will slow their rate of shrinkage, and that companies with growing free cash flow will see their growth rate slow, over this period. We do this to reflect that growth tends to slow more in the early years than it does in later years.
Generally we assume that a dollar today is more valuable than a dollar in the future, so we discount the value of these future cash flows to their estimated value in today's dollars:
10-year free cash flow (FCF) forecast
| 2024 | 2025 | 2026 | 2027 | 2028 | 2029 | 2030 | 2031 | 2032 | 2033 | |
| Levered FCF ($, Millions) | US$51.2b | US$67.2b | US$96.2b | US$99.1b | US$101.6b | US$104.1b | US$106.6b | US$109.0b | US$111.5b | US$113.9b |
| Growth Rate Estimate Source | Analyst x15 | Analyst x10 | Analyst x3 | Analyst x4 | Est @ 2.57% | Est @ 2.44% | Est @ 2.36% | Est @ 2.29% | Est @ 2.25% | Est @ 2.22% |
| Present Value ($, Millions) Discounted @ 7.6% | US$47.6k | US$58.0k | US$77.2k | US$73.9k | US$70.4k | US$67.1k | US$63.8k | US$60.6k | US$57.6k | US$54.7k |
("Est" = FCF growth rate estimated by Simply Wall St)
Present Value of 10-year Cash Flow (PVCF) = US$631b
The second stage is also known as Terminal Value, this is the business's cash flow after the first stage. For a number of reasons a very conservative growth rate is used that cannot exceed that of a country's GDP growth. In this case we have used the 5-year average of the 10-year government bond yield (2.2%) to estimate future growth. In the same way as with the 10-year 'growth' period, we discount future cash flows to today's value, using a cost of equity of 7.6%.
Terminal Value (TV)= FCF2033 × (1 + g) ÷ (r – g) = US$114b× (1 + 2.2%) ÷ (7.6%– 2.2%) = US$2.1t
Present Value of Terminal Value (PVTV)= TV / (1 + r)10= US$2.1t÷ ( 1 + 7.6%)10= US$1.0t
The total value, or equity value, is then the sum of the present value of the future cash flows, which in this case is US$1.7t. In the final step we divide the equity value by the number of shares outstanding. Compared to the current share price of US$135, the company appears about fair value at a 16% discount to where the stock price trades currently. Remember though, that this is just an approximate valuation, and like any complex formula - garbage in, garbage out.
The Assumptions
Now the most important inputs to a discounted cash flow are the discount rate, and of course, the actual cash flows. You don't have to agree with these inputs, I recommend redoing the calculations yourself and playing with them. The DCF also does not consider the possible cyclicality of an industry, or a company's future capital requirements, so it does not give a full picture of a company's potential performance. Given that we are looking at Amazon.com as potential shareholders, the cost of equity is used as the discount rate, rather than the cost of capital (or weighted average cost of capital, WACC) which accounts for debt. In this calculation we've used 7.6%, which is based on a levered beta of 1.091. Beta is a measure of a stock's volatility, compared to the market as a whole. We get our beta from the industry average beta of globally comparable companies, with an imposed limit between 0.8 and 2.0, which is a reasonable range for a stable business.
SWOT Analysis for Amazon.com
- Earnings growth over the past year exceeded its 5-year average.
- Debt is not viewed as a risk.
- Earnings growth over the past year underperformed the Multiline Retail industry.
- Annual earnings are forecast to grow faster than the American market.
- Current share price is below our estimate of fair value.
- Revenue is forecast to grow slower than 20% per year.
Next Steps:
Whilst important, the DCF calculation ideally won't be the sole piece of analysis you scrutinize for a company. DCF models are not the be-all and end-all of investment valuation. Rather it should be seen as a guide to "what assumptions need to be true for this stock to be under/overvalued?" For instance, if the terminal value growth rate is adjusted slightly, it can dramatically alter the overall result. For Amazon.com, we've put together three fundamental factors you should further research:
- Financial Health: Does AMZN have a healthy balance sheet? Take a look at our free balance sheet analysis with six simple checks on key factors like leverage and risk.
- Future Earnings: How does AMZN's growth rate compare to its peers and the wider market? Dig deeper into the analyst consensus number for the upcoming years by interacting with our free analyst growth expectation chart.
- Other Solid Businesses: Low debt, high returns on equity and good past performance are fundamental to a strong business. Why not explore our interactive list of stocks with solid business fundamentals to see if there are other companies you may not have considered!
PS. The Simply Wall St app conducts a discounted cash flow valuation for every stock on the NASDAQGS every day. If you want to find the calculation for other stocks just search here.
Valuation is complex, but we're helping make it simple.
Find out whether Amazon.com is potentially over or undervalued by checking out our comprehensive analysis, which includes fair value estimates, risks and warnings, dividends, insider transactions and financial health.
View the Free AnalysisHave feedback on this article? Concerned about the content? Get in touch with us directly. Alternatively, email editorial-team (at) simplywallst.com.
This article by Simply Wall St is general in nature. We provide commentary based on historical data and analyst forecasts only using an unbiased methodology and our articles are not intended to be financial advice. It does not constitute a recommendation to buy or sell any stock, and does not take account of your objectives, or your financial situation. We aim to bring you long-term focused analysis driven by fundamental data. Note that our analysis may not factor in the latest price-sensitive company announcements or qualitative material. Simply Wall St has no position in any stocks mentioned.
About NasdaqGS:AMZN
Amazon.com
Amazon.com, Inc. engages in the retail sale of consumer products and subscriptions through online and physical stores in North America and internationally.
Reasonable growth potential with proven track record.